Summary
Role: End-to-end project lead
Team & Partners: UX Leadership, Product COS, Engineering Managers, UX Team, Business Technology, Tool Vendors
Tools: Qualtrics, Claude, Gemini, IQL, Figma, Dovetail
Methods: Quantitative and qualitative research, survey design, statistical analysis, thematic synthesis, cross-functional stakeholder alignment, framework development
Key Takeaways:
Comprehensive data collection requires balancing quantitative rigor with qualitative depth. The optional follow-up questions yielded critical insights that informed our training priorities and quality initiatives.
Creating quality rubrics for AI-enhanced deliverables gave the organization a shared language and clear standards when everything felt ambiguous and rapidly changing.
Frameworks that solve real problems naturally scale beyond their original scope.
Impact:
Delivered first-in-company AI benchmark data with 60% team participation rate
12% increase in perceived quality of AI-generated deliverables within one month through targeted initiatives
Framework adopted by Product and Engineering teams, becoming R&D-wide template for AI measurement
Monthly reporting to C-suite leadership on AI adoption and business impact
“Amy’s work on benchmarking and measurement has been instrumental in shaping the narrative around AI adoption, and her ability to drive forward integrations with the IQL index showcases her systematic approach to complex data challenges.”
The Challenge
As AI tools rapidly proliferated across Indeed's UX organization, leadership had no systematic way to understand if AI was actually improving our work, how team members were using available tools, or where hesitant teammates needed support. Without quantified visibility into adoption and impact, we couldn't make informed investment decisions about tools, training, or resources—and risked investing in technology without knowing if it delivered value or created quality issues.
Problems to solve:
Leadership couldn't quantify how many UXers were using AI tools, for what tasks, or how frequently, making it impossible to measure ROI on tool investments, identify adoption barriers, or report accurate adoption data to Indeed leadership.
No framework for assessing whether AI-enhanced deliverables were actually better than traditional approaches, creating risk around output consistency and reliability
Without a replicable measurement framework, each team was tracking different metrics (or nothing at all), preventing organization-wide strategy and cross-functional coordination
Approach
Discovery & Research
I needed to design a measurement framework that would provide actionable insights for multiple audiences: UX leadership making investment decisions, managers supporting their teams, and cross-functional partners coordinating AI strategy across R&D. My discovery focused on understanding what questions needed answering and what data infrastructure already existed or could be built.
I conducted parallel streams of research—internal stakeholder alignment, technical data infrastructure assessment, and external benchmarking—to build a comprehensive understanding of both what we needed to measure and how we could realistically capture that data.
Insights
Usage analytics show what people do; surveys reveal why they do it and what barriers they face. A good framework needed to combine automated tool analytics with qualitative survey data to inform both strategy (what to invest in) and tactics (what training to provide).
Leadership's real question wasn't "are people using AI?" but "is AI making our work better and more efficient?" I needed to develop quality rubrics and measurement approaches that went beyond simple adoption metrics to assess actual output improvement.
Product and Engineering were independently building their own AI measurement approaches, risking duplicated effort and incompatible metrics. I accelerated my timeframe and shared UX’s approach first, allowing Product and Engineering to follow our lead. An R&D-wide standard would increase efficiency and enable better cross-functional strategy decisions.
Design
I developed a four-pillar measurement framework covering the full spectrum from adoption through business impact:
Time Saved, efficiency gains
Value Creation & Impact, business outcomes
Quality, output consistency, and reliability
Proficiency, skill development, and confidence
This framework provided both immediate tactical insights and long-term strategic visibility. The quality pillar was particularly critical and novel—I created rubrics defining what "good" looks like for AI-enhanced deliverables, enabling both self-assessment and cross-functional evaluation. This moved us beyond "did we use AI?" to "was the result better?"
Defining Quality
The quality pillar was particularly critical and novel—no one else in the organization had tackled this. I created a rubric defining what “good” looks like for AI-enhanced deliverables, providing both self-assessment criteria for creators and evaluation standards for cross-functional reviewers. The rubrics covered:
Accuracy: Does the AI output contain factual errors or require significant correction?
Consistency: Does the output match our brand standards and design patterns?
Completeness: Does it address the full scope of the need, or just provide a partial solution?
Efficiency: Did using AI actually save time, or did verification and correction negate the benefits?
These quality frameworks moved us beyond “did we use AI?” to “was the result better?” They gave teams concrete evaluation criteria during a period of rapid change and uncertainty, enabling productive conversations about output consistency and helping team members develop their AI skills with clear targets.
Survey Strategy
The survey needed to maximize response rate while capturing both quantitative benchmarks and qualitative insights. I optimized the design for minimal time investment and maximum output:
5 minutes for required questions built trust and managed expectations
Only questions essential for benchmarking were required; everything else was optional
Optional follow-up questions appeared based on previous answers, allowing motivated respondents to provide rich context without overwhelming others
Scaled questions for quantitative analysis, multiple choice for pattern identification, and open-ended for unexpected insights
Repeated assurances that responses were anonymous and aggregated, building trust for honest feedback
The optional follow-up questions were strategically crucial—they yielded critical insights that numbers alone couldn't capture. For instance, when someone rated their AI proficiency low, an optional follow-up asked what specific barriers they faced. These responses directly informed our training priorities and revealed workflow integration challenges that weren't visible in usage data.
Validation & Alignment
Before launching the survey and committing to the framework, I conducted multi-layered validation to ensure it would deliver value and gain buy-in. I spoke with UX Leadership, Subject Matter Experts (researchers, data science, AI power users), and Product and Engineering leadership and partners to review the proposed metrics and survey structure, integrating feedback after review.
Deployment
I launched the benchmark survey to all 203 UX team members on September 1st, using a multi-channel communication strategy to maximize participation. The announcement emphasized the survey's strategic importance, the time commitment, and the guarantee of anonymity. Reminders were sent at strategic intervals to reach people who missed the initial launch, ultimately achieving a 60% participation rate (122 quantitative responses, 100 qualitative responses) for the first survey.
This response rate exceeded typical internal survey benchmarks and provided statistically significant data for analysis. The high participation rate validated the survey design and demonstrated the organization's appetite for better AI understanding.
Complementary Data Sources
The survey data told one part of the story, but I also partnered with multiple teams to establish automated data pipelines that demonstrated how Indeedians were using AI in two tools: Figma and Dovetail.
Internal Analytics Platform (IQL): Worked with business technology teams to track AI tool adoption in Indeed's internal query language platform. This required defining what "AI usage" meant in different contexts, setting up tracking parameters, and establishing a regular reporting cadence.
Vendor Analytics Partnerships: Collaborated directly with Figma and Dovetail to develop custom reporting that surfaced AI feature usage across the UX organization.
These partnerships improved data access not just for my project but for the entire organization going forward. UX was the first team beyond Engineering to report results in IQL.
Analysis & Reporting
With multiple data sources feeding in, I developed a systematic analysis process:
Quantitative Analysis:
Calculated key statistics (means, medians, distributions) for all scaled questions
Segmented data by role, discipline, tenure, and team to identify patterns
Tracked proficiency scores and tool adoption rates
Compared self-reported time savings against actual usage patterns
Applied statistical tests to ensure findings were significant, not just noise
Qualitative Synthesis:
Coded all open-ended responses using thematic analysis
Identified recurring themes, barriers, and success stories
Looked for contradictions between quantitative and qualitative data (e.g., high usage but low satisfaction)
Pulled representative quotes that illustrated key themes
Flagged unexpected insights that didn't fit existing assumptions
Integrated Analysis: The real insights emerged when I layered quantitative and qualitative together. For example, usage data showed 80% adoption of AI features, but qualitative responses revealed many users didn't trust the outputs and spent significant time verifying. This nuanced picture—high adoption but low confidence—directly shaped our quality initiatives and training focus.
Findings & Reporting
I synthesized the analysis into comprehensive reports for different audiences:
For UX Leadership: Created a strategic overview focused on key takeaways, trends, and recommendations. Highlighted where AI was delivering value, where barriers existed, and what investments (tools, training, process changes) would drive improvement. Included specific proficiency metrics and quality scores with clear benchmarks for tracking progress.
For Managers: Developed team-level insights (when sample sizes allowed) showing how their teams compared to organizational averages. Provided specific talking points for 1:1s and team discussions about AI adoption, including resources to address common concerns.
For Cross-Functional Partners: Shared coordinated metrics that Product and Engineering teams could compare against their own data, enabling R&D-wide strategy conversations. This positioned UX's framework as the template others could adopt.
For C-Suite: Contributed to Indeed's monthly scorecard reporting with executive-level AI metrics and narrative highlights. This elevated UX's visibility as a data-driven organization and ensured AI strategy was informed by actual usage and impact data.
The reporting wasn't just data presentation—it was strategic storytelling that connected metrics to business outcomes and provided clear paths forward.
Analysis & Reporting
To understand the results, I analyzed the qualitative and quantitative data with AI tools in order to report out findings for UX leadership, cross-functional partners, and Indeed’s C-suite. The reporting wasn't just data presentation—it was strategic storytelling that connected metrics to business outcomes and provided clear paths forward.
The real insights emerged when I layered quantitative and qualitative data together. For example, usage data showed 80% adoption of AI features, but qualitative responses revealed that many users didn't trust the outputs and spent significant time verifying them. This nuanced picture—high adoption but low confidence—directly shaped our quality initiatives and training focus.
The analysis was shared as comprehensive reports for different audiences:
For UX Leadership: Created a strategic overview focused on key takeaways, trends, and recommendations. Highlighted where AI was delivering value, where barriers existed, and what investments (tools, training, process changes) would drive improvement. Included specific proficiency metrics and quality scores with clear benchmarks for tracking progress.
For Cross-Functional Partners: Shared coordinated metrics that Product and Engineering teams could compare against their own data, enabling R&D-wide strategy conversations. This positioned UX's framework as the template others could adopt.
For C-Suite: Contributed to Indeed's monthly scorecard reporting with executive-level AI metrics and narrative highlights. This elevated UX's visibility as a data-driven organization and ensured the AI strategy was informed by actual usage and impact data.

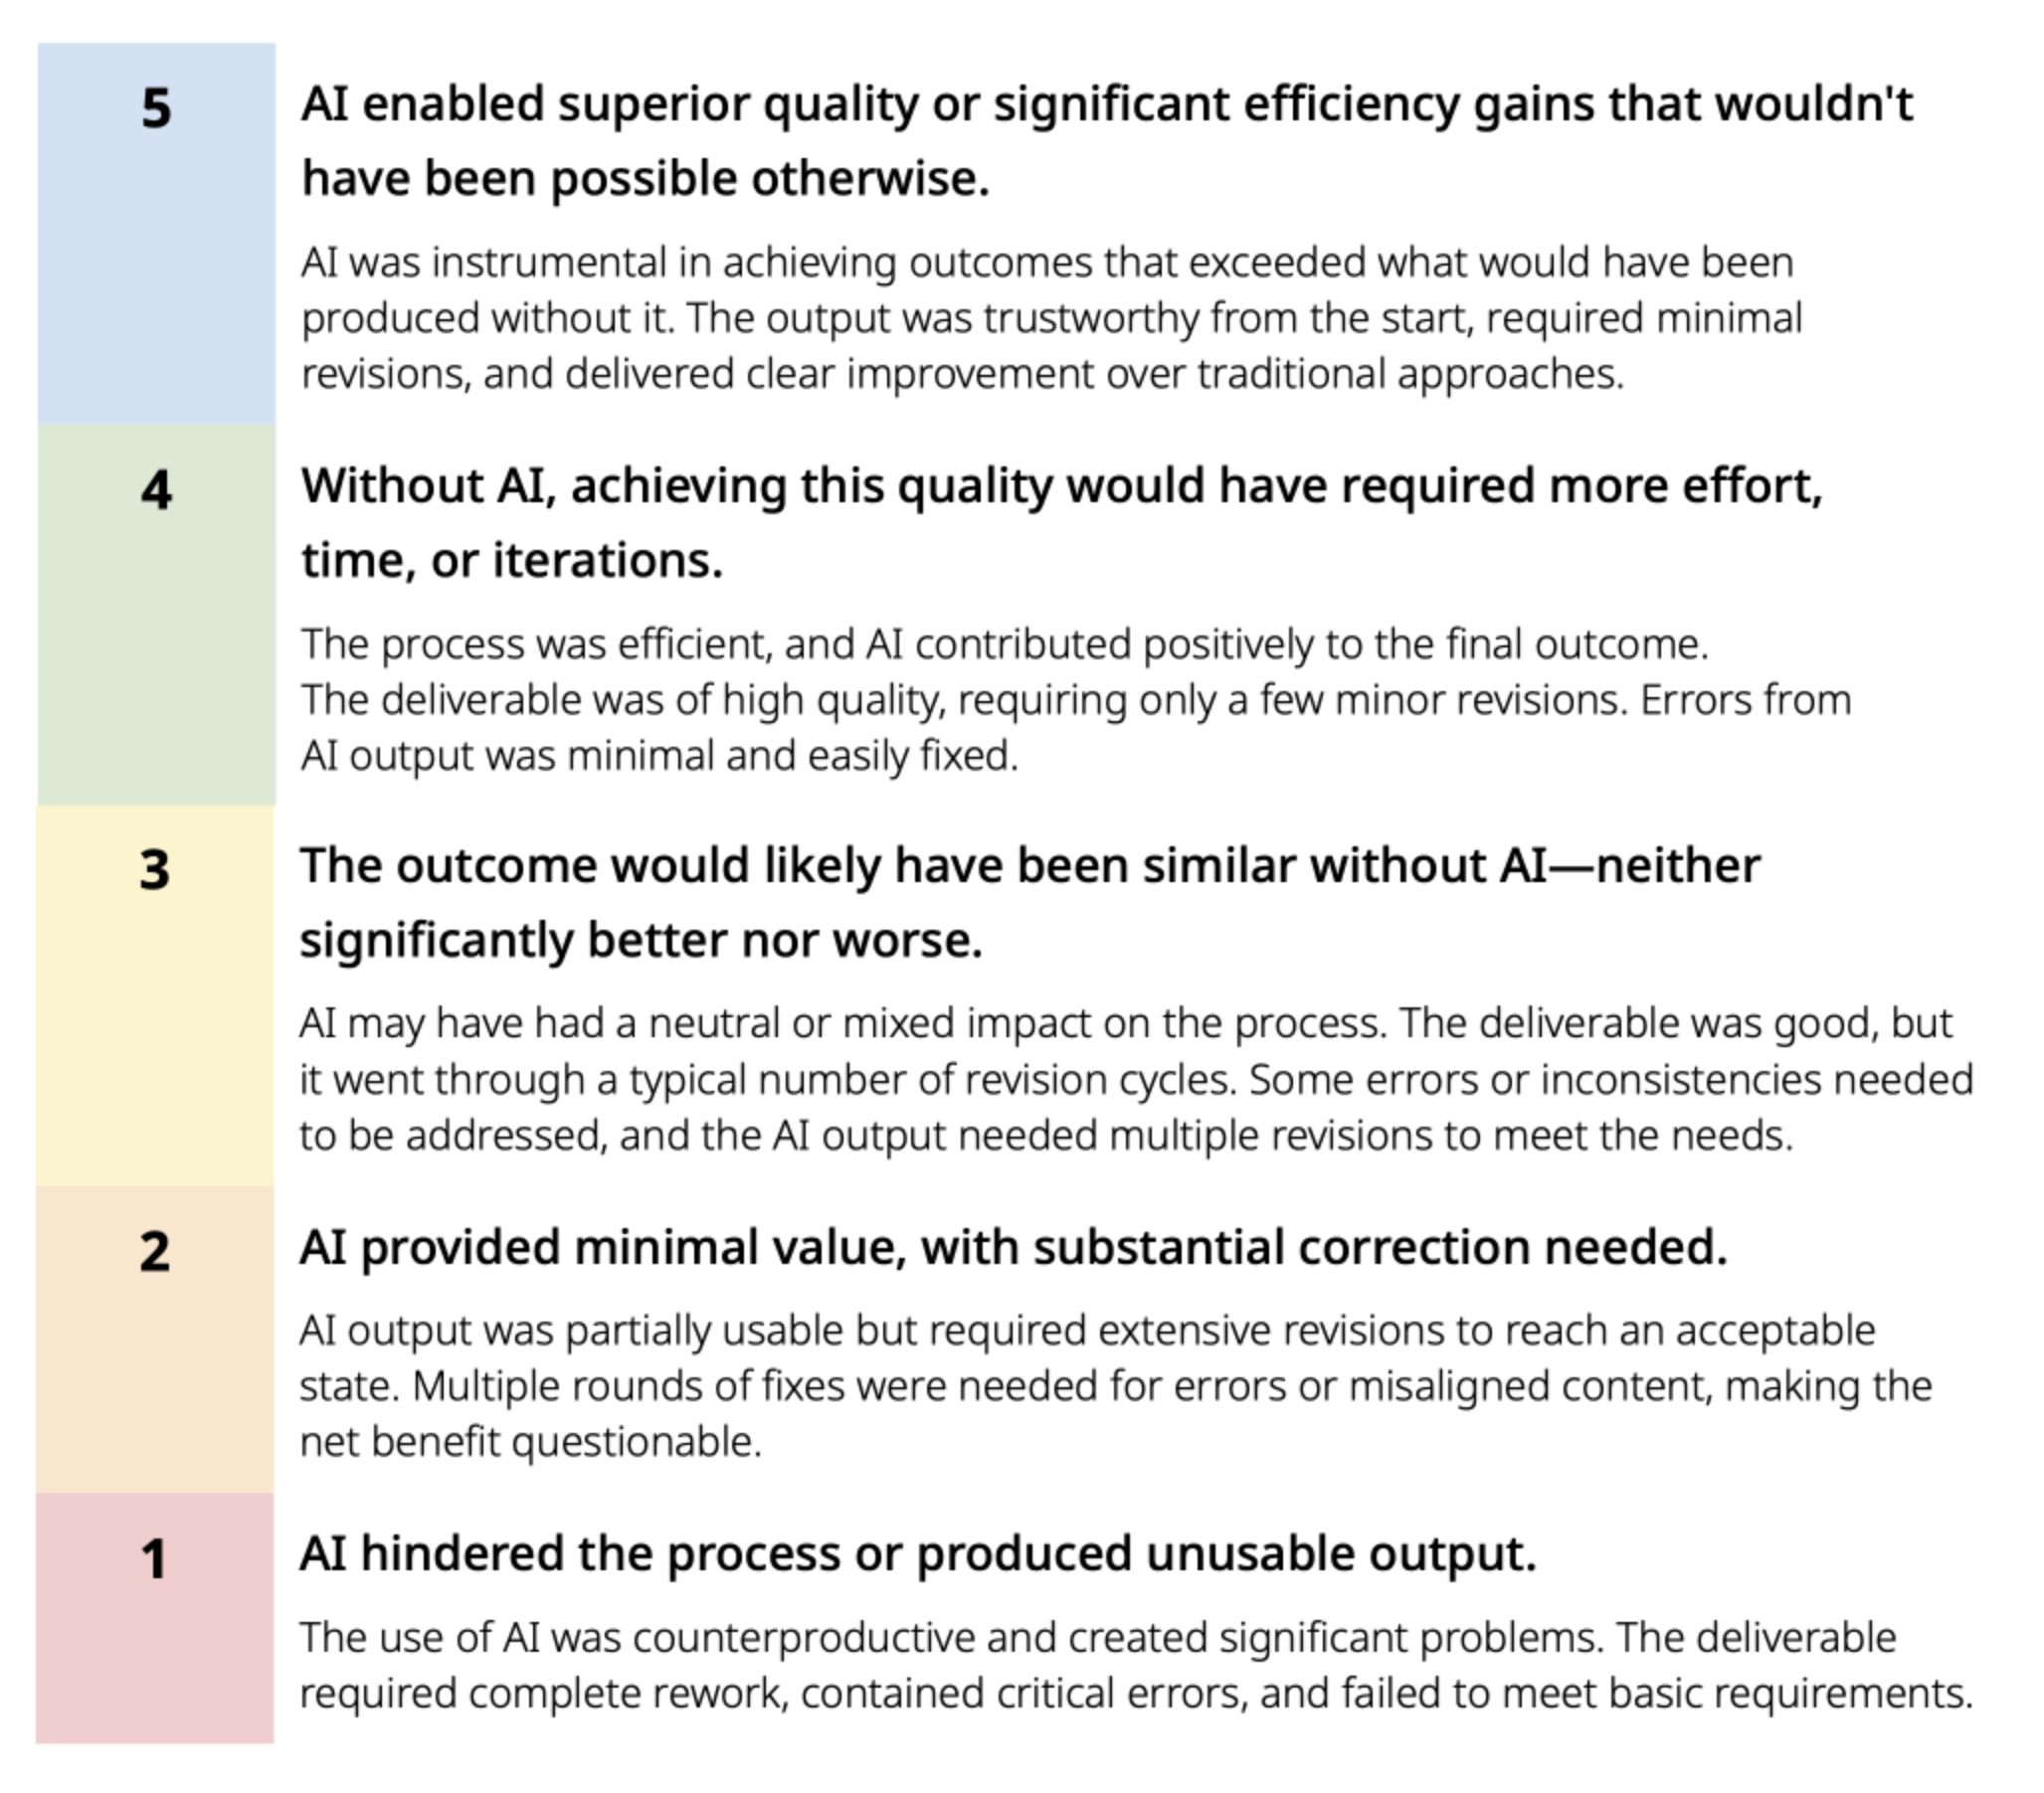
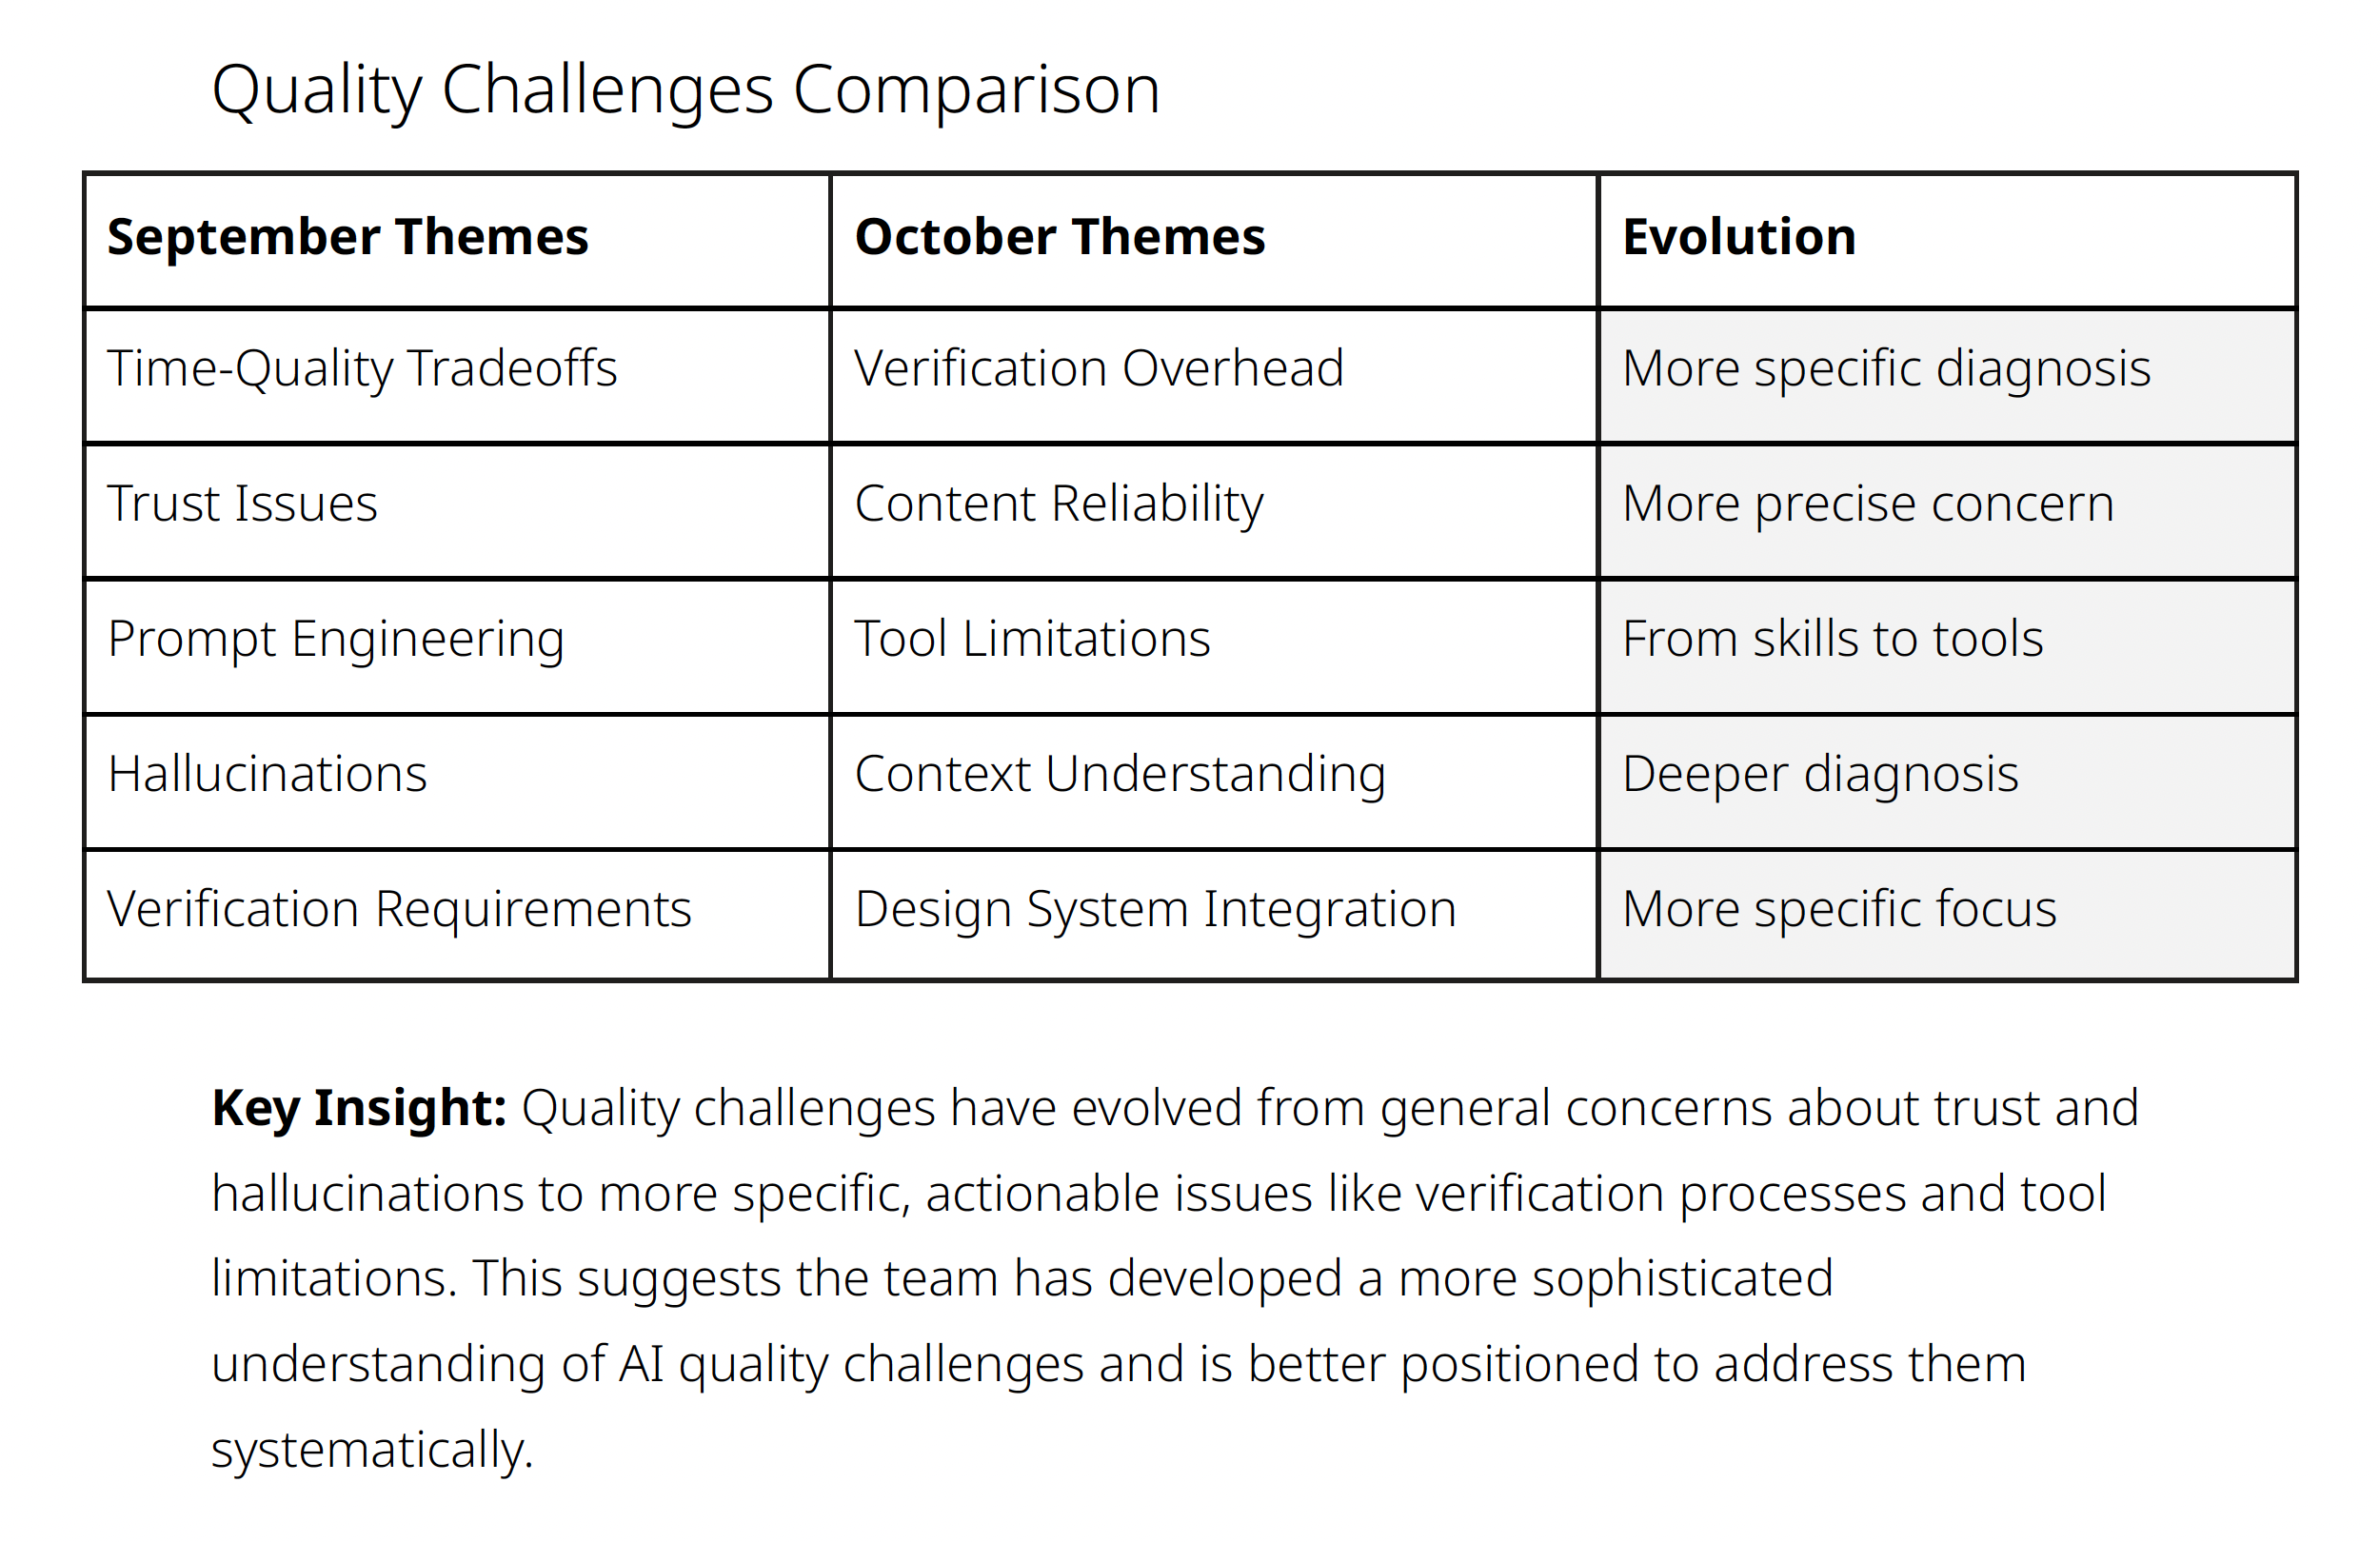
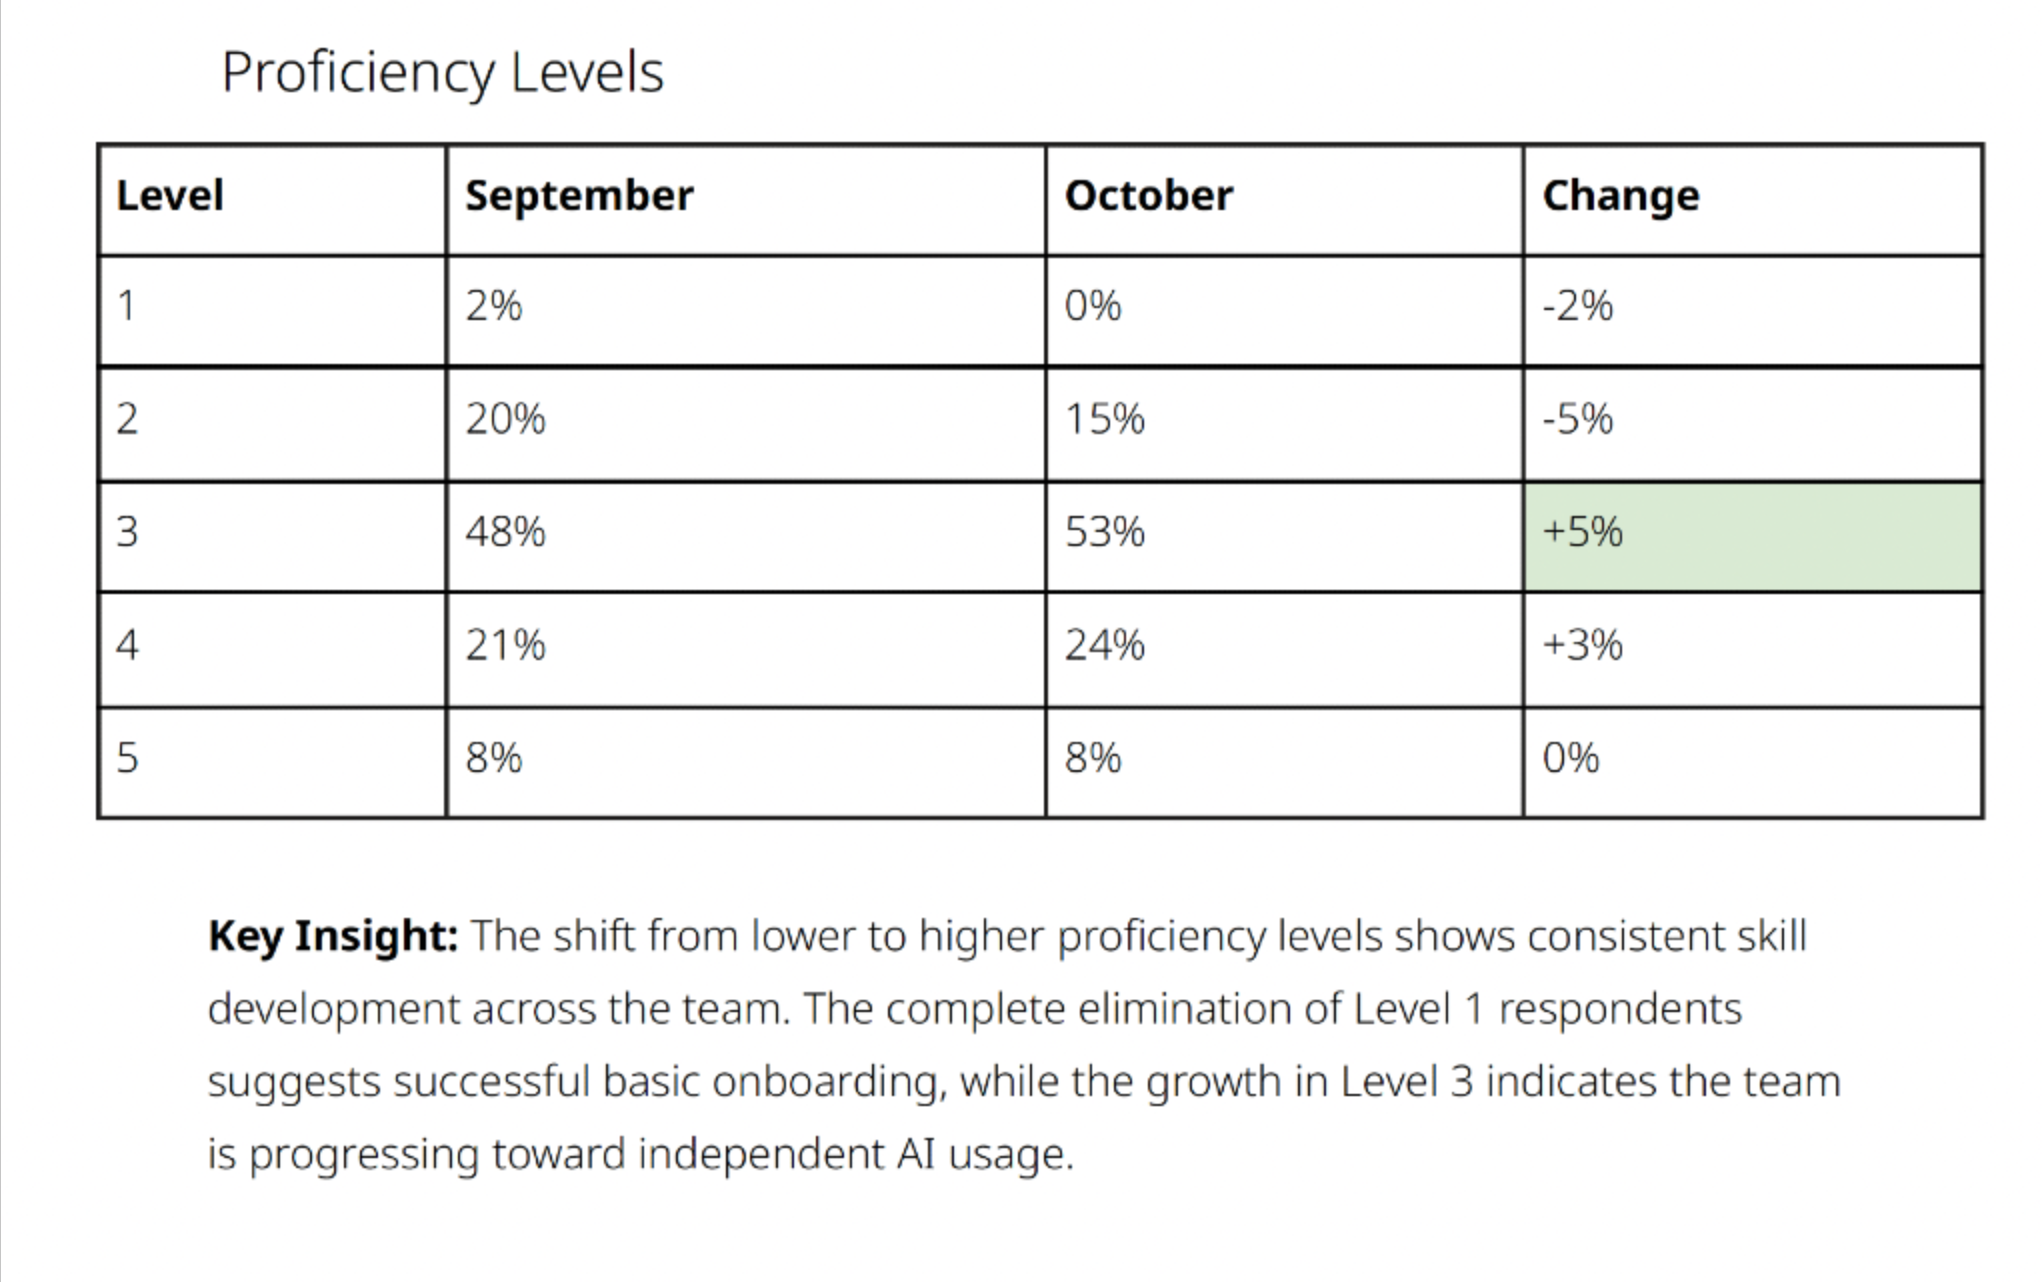
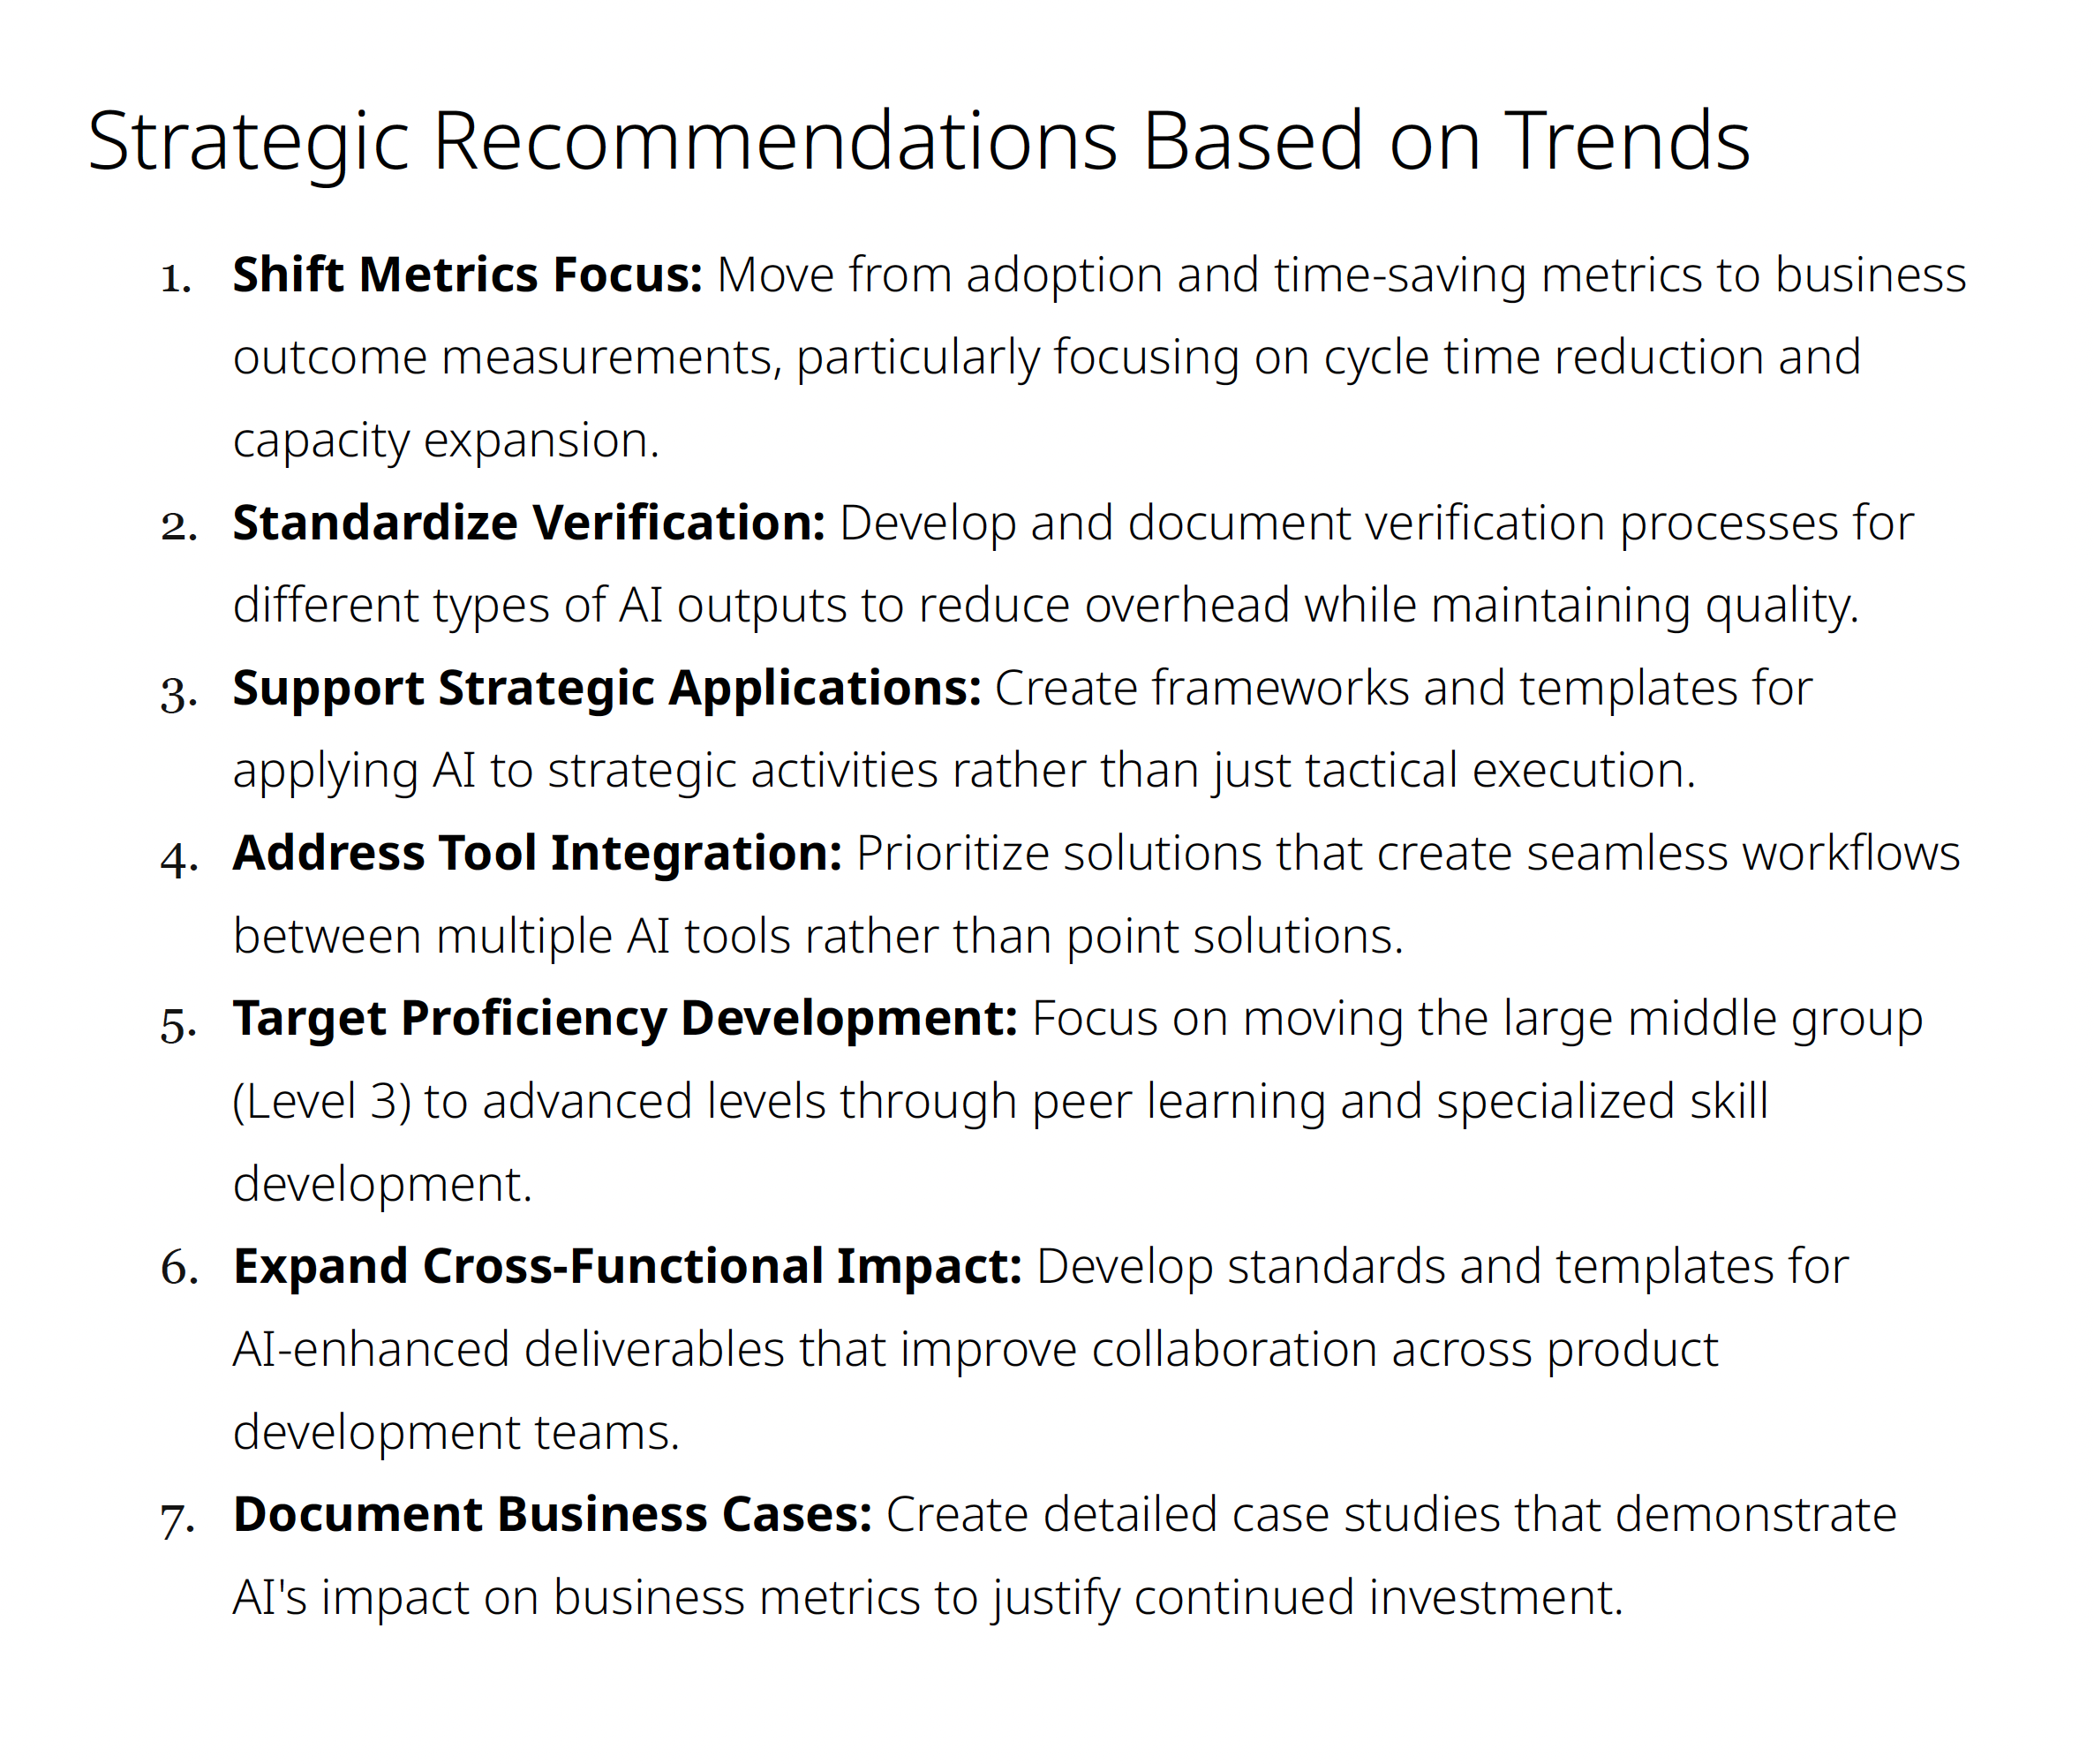
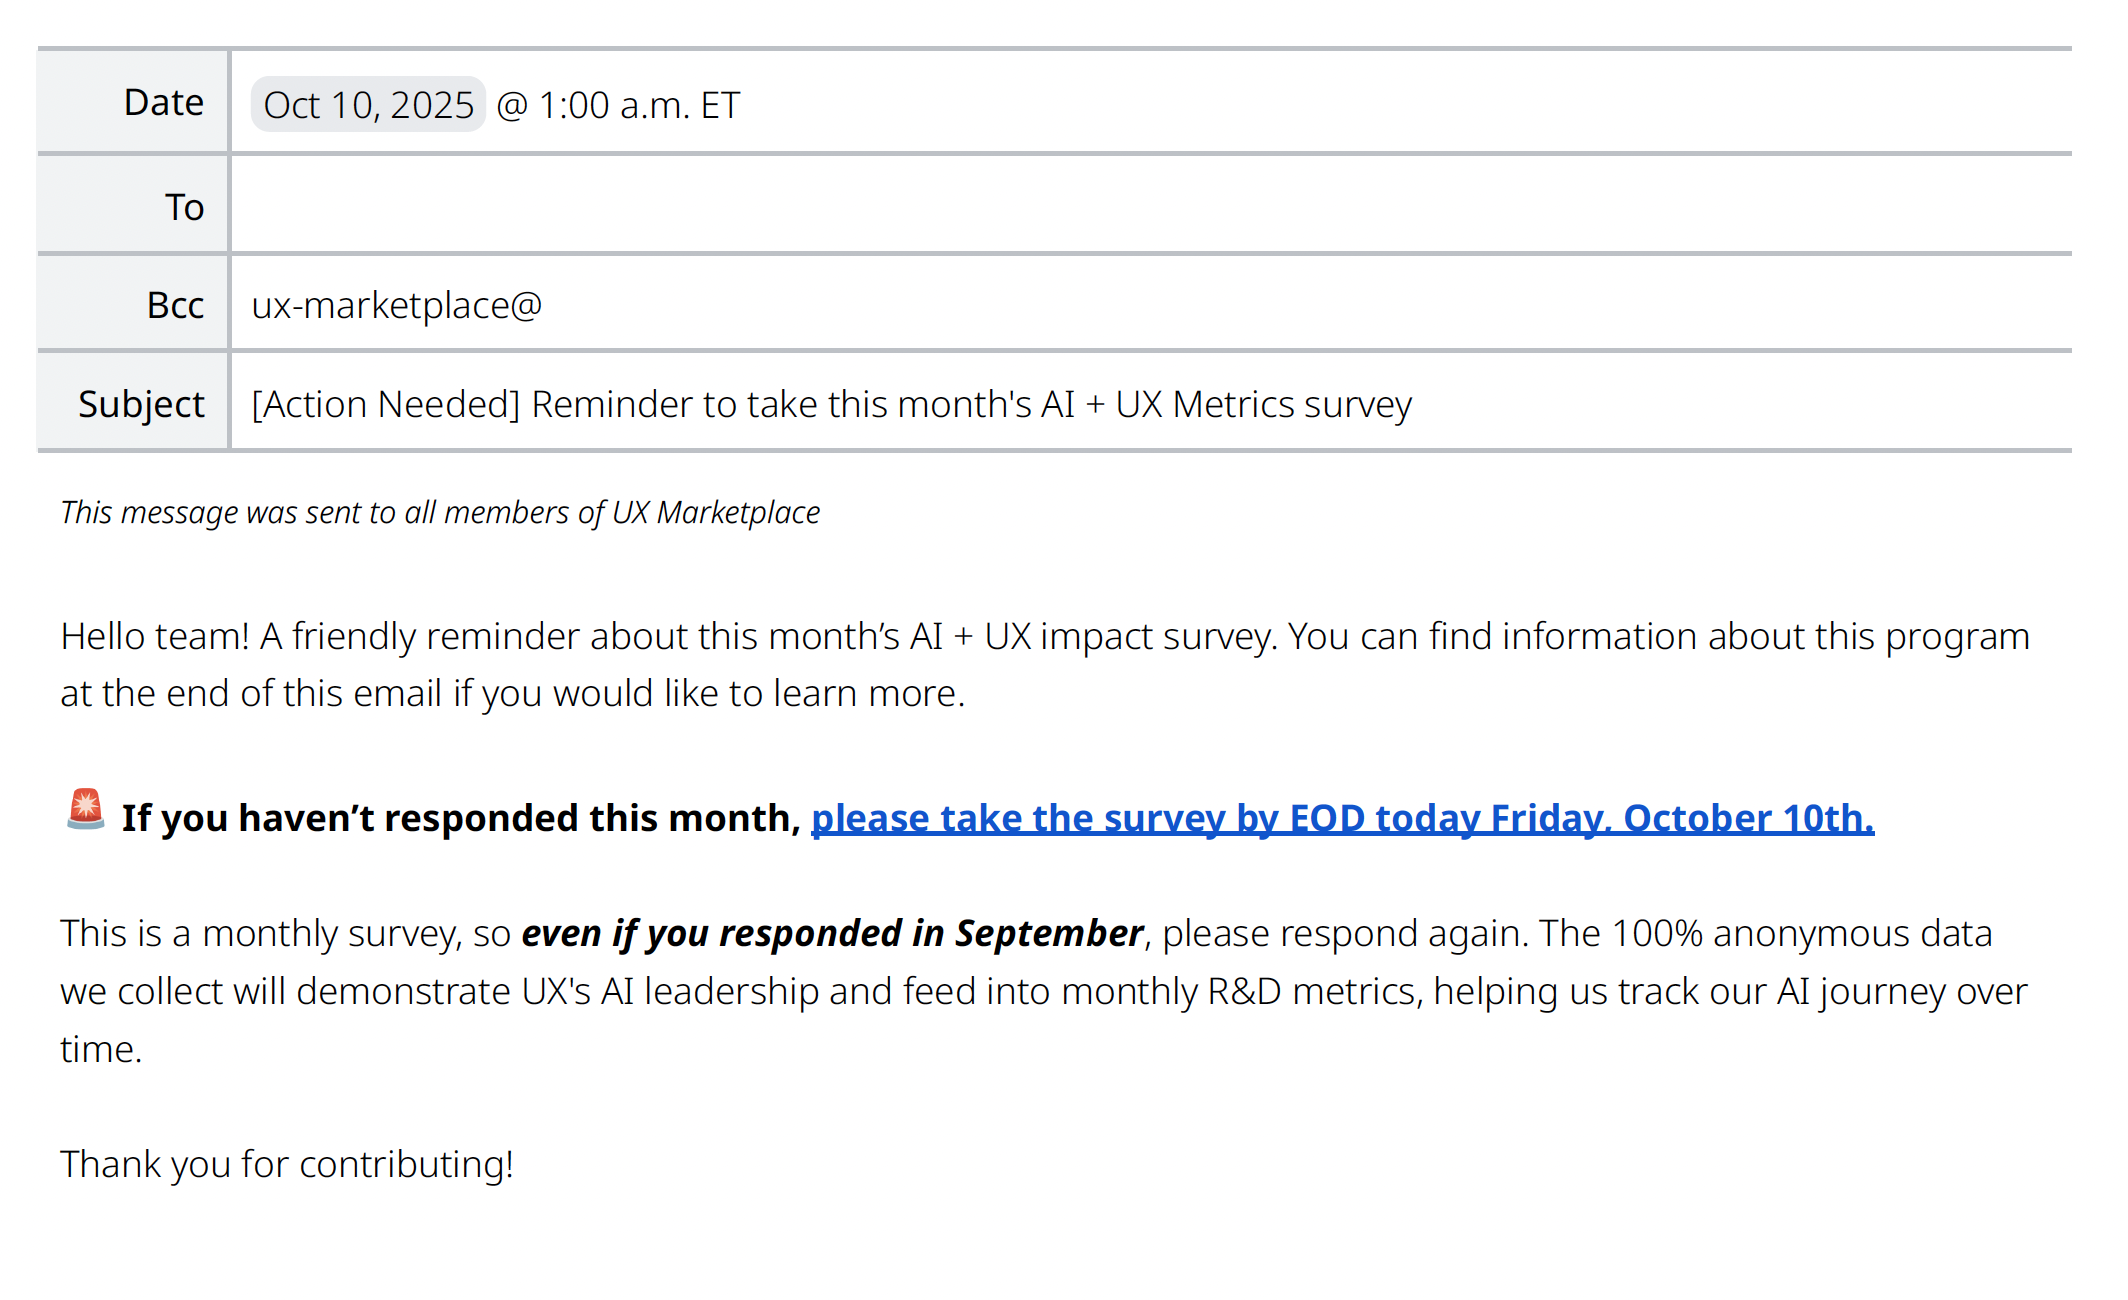
Image 1. Example metric overview from the AI + UX Metrics playbook.
Image 2. Rubric for defining the quality of AI-enhanced deliverables.
Image 3. Comparison of quality data from September to October 2025.
Image 4. Comparison of proficiency data from September to October 2025.
Image 5. Outlined recommendations from the October 2025 survey results readout.
Image 6. Sample communication to community for survey participation.
Results & Impact
Outcomes
60% survey participation rate (122 of 203 UXers) in September provided statistically significant benchmark data that leadership trusted for decision-making.
Targeted quality initiatives informed by survey insights led to 12% increase in perceived quality of AI-generated deliverables within just one month.
Designed and delivered 3 UX-wide training sessions and 5 demo recordings directly addressing proficiency gaps identified in the data, contributing to 2-5% proficiency gains across disciplines.
Product and Engineering teams adopted the measurement approach as their template, making it the R&D-wide standard for AI tracking.
Monthly reporting to C-suite leadership positioned UX as a data-driven and informed company-wide AI investment strategy.
Key Wins
Teams now had concrete criteria for evaluating AI outputs, improving consistency across the organization and enabling productive conversations about quality expectations
Survey insights revealed that when the organization had moved past basic adoption questions to deeper concerns about impact and trust, informing the evolution of metrics for future measurement cycles
Collaboration with Figma and Dovetail on analytics reporting improved data access, not just for this project but for the entire organization going forward
UX delivered Indeed's first comprehensive AI benchmark data, establishing us as thought leaders and making our framework the template others adopted rather than building competing approaches
Reflection & Evolution
The data showed that UXers had become significantly more comfortable using AI in their workflows. Proficiency scores had increased, adoption rates plateaued at high levels, and qualitative feedback shifted from "how do I use this?" to "how do I use this better?" and "how do I ensure quality?"
With basic adoption established, I recommended shifting measurement focus from "are people using AI?" to "is AI making a meaningful impact?" This meant evolving metrics to emphasize:
Trust in outputs: "I trust the outputs I create with AI" (1-5 scale) to understand confidence levels
Verification efficiency: "I spend _____ time verifying or correcting AI outputs" (More/Less/Same) to track whether time savings were real or eaten by quality checks
Business impact: Concrete examples of how AI-enabled work that wouldn't have been possible otherwise, scaled existing work, or freed capacity for higher-value activities
This evolution demonstrated the framework's flexibility—it wasn't locked into fixed metrics but could adapt as organizational needs and AI maturity changed.